Implementing TQI
Prototype queries have been identified to identify constraint violations. Several of these queries are quite complex but their final form will be dependent on the use-case as well as the graph data model.
As a simple example, the following query identifies students with back-to-back activities in different buildings, highlighting a potential travel time issue:
// Identify students with back-to-back activities in different buildings
MATCH (s:Student)-[:ATTENDS]->(a1:Activity)-[:NEXT]->(a2:Activity)
WHERE a1.endTime = a2.startTime AND a1.building <> a2.building
RETURN s.name, a1.name, a2.name, a1.building, a2.building
Or we could craft a query to calculate the travel time between back-to-back activities:
// Calculate travel time between consecutive activities for a student on a specific date
MATCH (s:student {stuFullName_anon: "David Johnson"})-[:ATTENDS]->(a1:activity)-[:OCCUPIES]->(r1:room),
      (s)-[:ATTENDS]->(a2:activity)-[:OCCUPIES]->(r2:room)
WHERE a1.actEndTime = a2.actStartTime AND a1.actStartDate = a2.actStartDate AND a1 <> a2 AND
      a1.actStartDate IN [date("2023-01-11"), date("2022-09-27"), date("2023-03-14")]
RETURN DISTINCT
    s.stuFullName_anon,
    a1.actName AS act1, a1.actStartDate AS date, a1.actStartTime+"-"+a1.actEndTime AS act1Times, a2.actStartTime+"-"+a2.actEndTime AS act2Times, a2.actName AS act2,
    point.distance(r1.location, r2.location) AS distance,
    round(point.distance(r1.location, r2.location) / 1.4) AS walkingTimeSeconds // Calculate walking time in seconds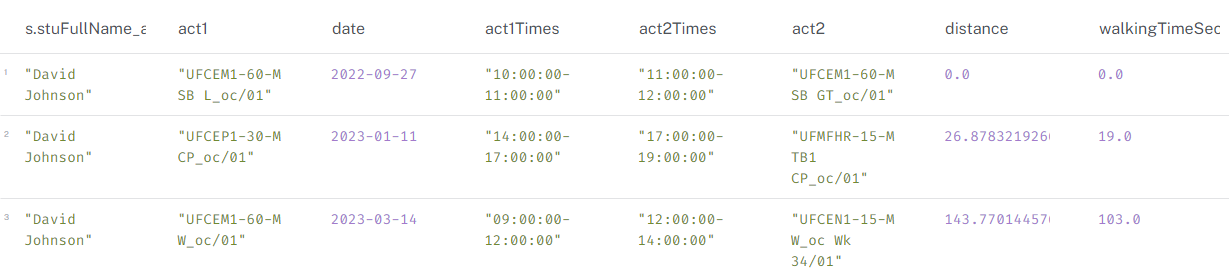
See Cypher Queries - Hard Constraints and Cypher Queries - Soft Constraints for more examples and details.
Penalty and Reward System
One way of implementing this is to store the quality score as a property on the relevant node (student, programme, room, etc.). Starting with a baseline score, the quality score is dynamically updated by subtracting penalties and adding rewards based on the specific metrics calculated. The weighting of these penalties and rewards can be adjusted to reflect institutional priorities.
Using the back-to-back activities example above, we can imagine using either distance or walkingTimeSeconds and a sliding scale to calculate a penalty. For example, if the walking time is greater than 5 minutes, a penalty of -3 points could be applied with the penalty increasing as the walking time increases.
Further examples:
No lunch break: -5 points
Back-to-back activities 5+ minutes apart: -3 points per instance
Activity clash: -10 points
Room at full capacity: -2 points
High room utilisation rate: +2 points