• Home
  • Project
    Introduction
    • Introduction
    • Background and Motivation
    • What is a Good Timetable?
    • Project Aims and Scope
  • Graph Data
    Model
    • Graph vs Relational Data Models
    • Graph Data Model for Timetabling
    • Early Insights
    • Model Expansion
    • Graphing Time
  • Data
    Pipeline
    • ETL Overview
    • Approach
    • Configuration and Logging
    • Extract
    • Transform
    • Google Drive Load
    • Neo4j Load
    • Reflection
  • Timetable
    Metrics
    • Timetable Metrics
    • Metric Aggregations
    • Implementing Metrics
    • TQI Summary
  • Final
    Thoughts
  • Appendices
    & Extras
    • Appendix Table of Contents
    • References
    • Acknowledgements
  • Word
  1. Graph Data Model
  2. Graph Data Model for Timetabling
  • Home
  • Project Introduction
    • Introduction
    • Background and Motivation
    • What is a Good Timetable?
    • Project Aims and Scope
  • Graph Data Model
    • Graph vs Relational Data Models
    • Graph Data Model for Timetabling
    • Early Insights
    • Model Expansion
    • Graphing Time
  • Data Pipeline
    • ETL Overview
    • Approach
    • Configuration and Logging
    • Extract
    • Transform
    • Google Drive Load
    • Neo4j Load
    • Reflection
  • Timetable Metrics
    • Timetable Metrics
    • Metric Aggregations
    • Implementing Metrics
    • TQI Summary
  • Final Thoughts
  • Appendices
    • Random Graph Generator
    • Technology Stack
    • Configuration
    • Anonymisation
    • ETL Summary and Code
      • ETL Summary
      • ETL Code
      • Config and Misc
      • Extract-SQL
      • Extract
      • Google Drive Load
      • Transform
      • Neo4j Load
    • Neo4j & Cypher Code
      • Cypher Queries
      • Creating Nodes and Relationships
      • Deleting Nodes and Relationships
      • General Queries
      • Count Queries
      • Hard (timetabling) Constraints
      • Student Clashes
      • Soft Constraints
      • Rooms and Spaces
      • Perspectives
      • Blue Skies Opportunities
  • Supervision
    • Supervision
    • Notes Example 1
    • Notes Example 2
    • Notes Example 3
  • References
  • Acknowledgements

On this page

  • An Iterative Approach
  • Core Nodes - Building Blocks
  • Relationships - Connecting the Dots
  • MVP model
  1. Graph Data Model
  2. Graph Data Model for Timetabling

Graph Data Model for Timetabling

Having discussed advantages of graph databases for representing interconnected data, this section delves into the specifics of a proposed graph data model tailored for university timetabling.

An Iterative Approach

Due to flexibility, creating graph data models is an iterative process: design -> build -> test -> review -> revise -> …and repeat.

My first model was small in scope, incorporating minimal nodes and properties in an MVP1 approach. Eventually, my expanded model was created in a cloud-instance of Neo4j Aura.

Core Nodes - Building Blocks

At its core, the timetable model revolves around four key entities represented as nodes:

Node Property Description Data Type
Student firstName Legal first name string
lastName Legal last name string
studentID University identifier integer
splusID Timetable URN string
Lecturer firstName First name string
lastName Last name string
staffID University identifier integer
splusID Timetable URN string
Room name Room name string
splusID Timetable URN integer
Activity name Activity name string
description Activity description string
startTime Scheduled start time datetime
endTime Scheduled end time datetime
date Date of activity date

Relationships - Connecting the Dots

The core nodes are interconnected through relationships that reflect the dynamics of a timetable:

  • (Student)-[IS_ALLOCATED_TO]->(Activity)
  • (Staff)-[TEACHES_ON]->(Activity)
  • (Activity)-[TAKES_PLACE_IN]->(Room)

MVP model
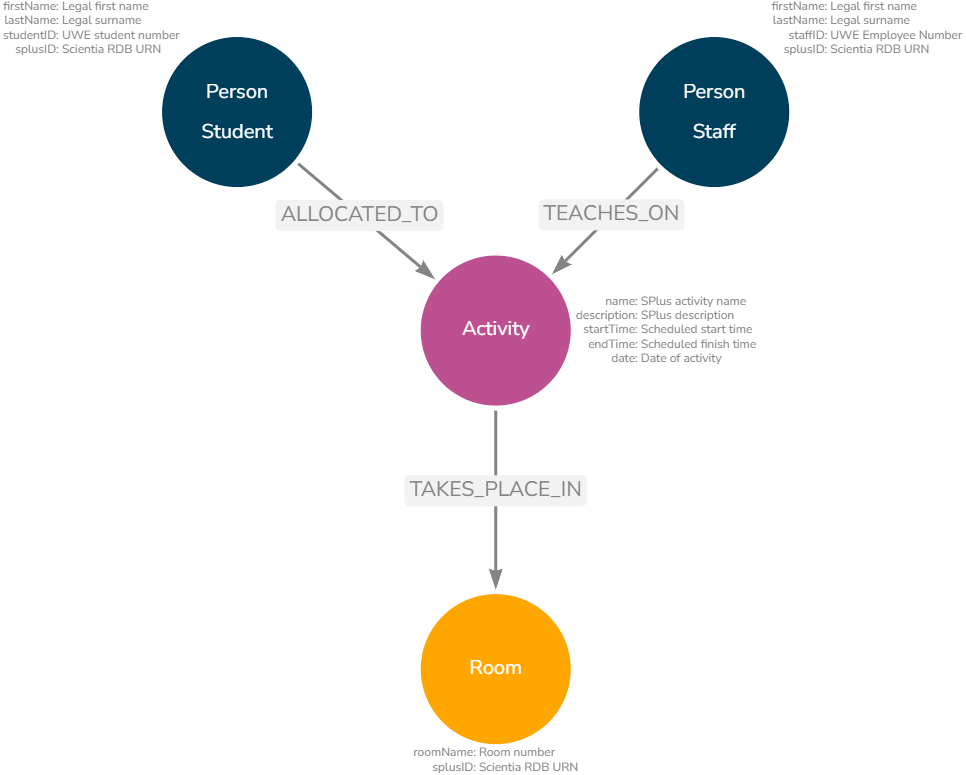
Core Nodes and Properties

Core Nodes and Properties

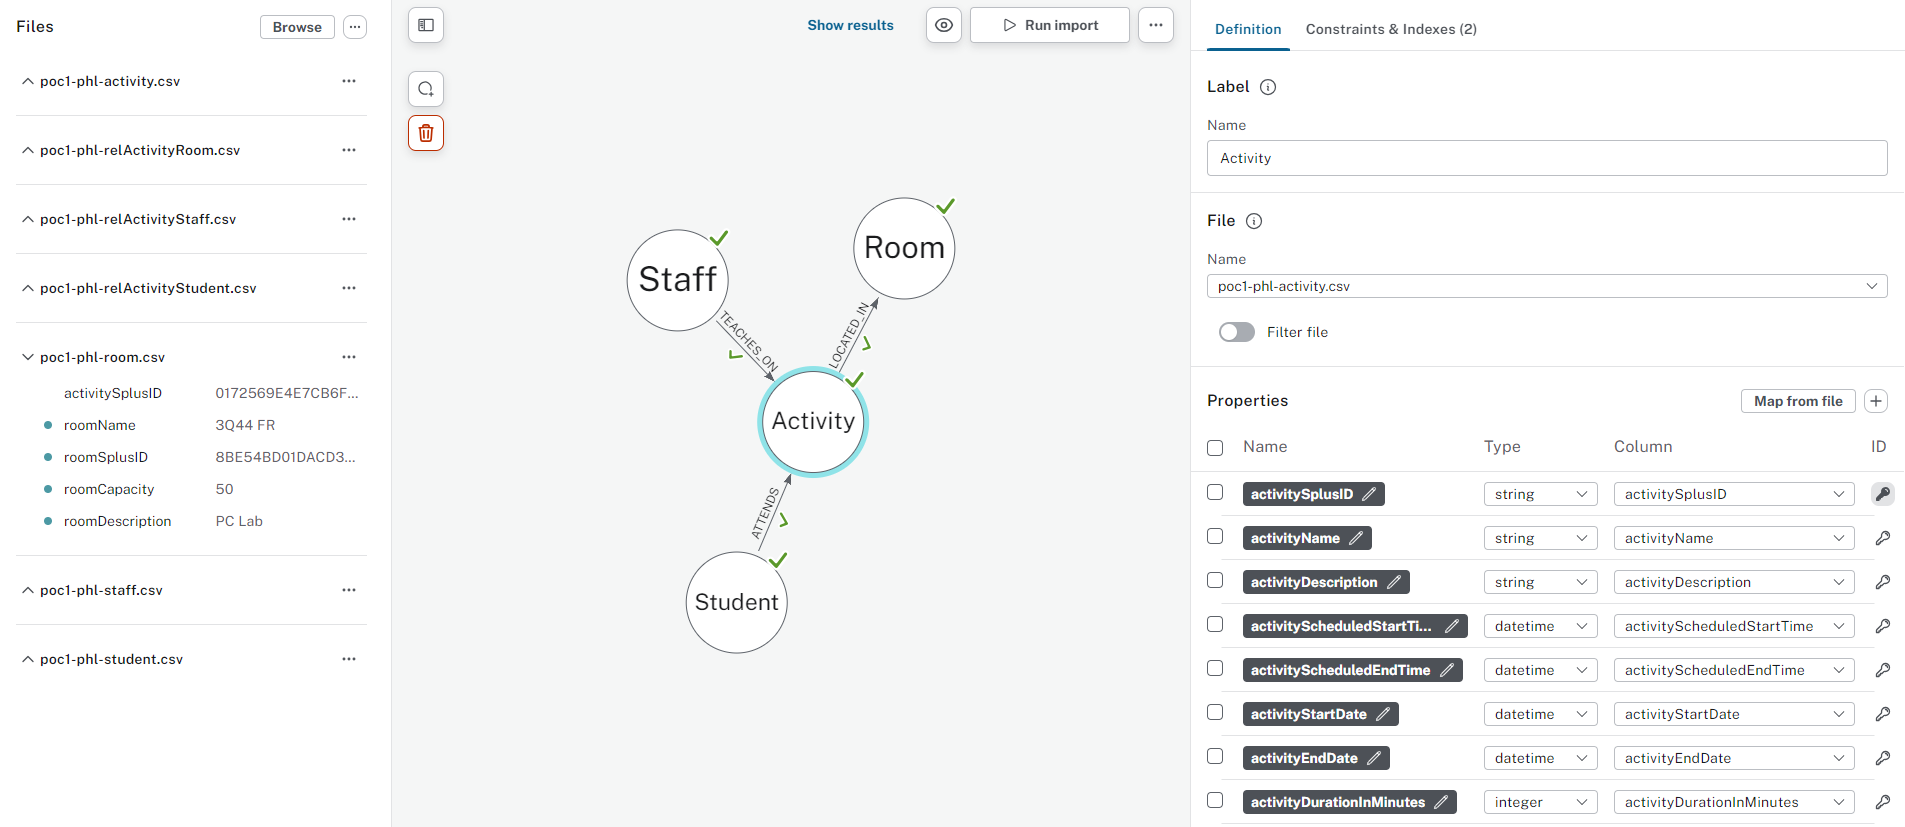
Neo4j Interface showing basic nodes and properties

Neo4j Interface showing basic nodes and properties

Footnotes

  1. Minimum Viable Product: “First, a definition: the minimum viable product is that version of a new product which allows a team to collect the maximum amount of validated learning about customers with the least effort or in other words building the most minimum version of their product that will still allow them to learn.” (Ries, 2024)↩︎

Graph vs Relational Data Models
Early Insights

Copyright 2024, Petter Lövehagen


Built with Quarto