• Home
  • Project
    Introduction
    • Introduction
    • Background and Motivation
    • What is a Good Timetable?
    • Project Aims and Scope
  • Graph Data
    Model
    • Graph vs Relational Data Models
    • Graph Data Model for Timetabling
    • Early Insights
    • Model Expansion
    • Graphing Time
  • Data
    Pipeline
    • ETL Overview
    • Approach
    • Configuration and Logging
    • Extract
    • Transform
    • Google Drive Load
    • Neo4j Load
    • Reflection
  • Timetable
    Metrics
    • Timetable Metrics
    • Metric Aggregations
    • Implementing Metrics
    • TQI Summary
  • Final
    Thoughts
  • Appendices
    & Extras
    • Appendix Table of Contents
    • References
    • Acknowledgements
  • Word
  1. Graph Data Model
  2. Model Expansion
  • Home
  • Project Introduction
    • Introduction
    • Background and Motivation
    • What is a Good Timetable?
    • Project Aims and Scope
  • Graph Data Model
    • Graph vs Relational Data Models
    • Graph Data Model for Timetabling
    • Early Insights
    • Model Expansion
    • Graphing Time
  • Data Pipeline
    • ETL Overview
    • Approach
    • Configuration and Logging
    • Extract
    • Transform
    • Google Drive Load
    • Neo4j Load
    • Reflection
  • Timetable Metrics
    • Timetable Metrics
    • Metric Aggregations
    • Implementing Metrics
    • TQI Summary
  • Final Thoughts
  • Appendices
    • Random Graph Generator
    • Technology Stack
    • Configuration
    • Anonymisation
    • ETL Summary and Code
      • ETL Summary
      • ETL Code
      • Config and Misc
      • Extract-SQL
      • Extract
      • Google Drive Load
      • Transform
      • Neo4j Load
    • Neo4j & Cypher Code
      • Cypher Queries
      • Creating Nodes and Relationships
      • Deleting Nodes and Relationships
      • General Queries
      • Count Queries
      • Hard (timetabling) Constraints
      • Student Clashes
      • Soft Constraints
      • Rooms and Spaces
      • Perspectives
      • Blue Skies Opportunities
  • Supervision
    • Supervision
    • Notes Example 1
    • Notes Example 2
    • Notes Example 3
  • References
  • Acknowledgements

On this page

  • Potential Expansions:
  1. Graph Data Model
  2. Model Expansion

Model Expansion

The true power of the graph model lies in its extensibility. Introducing additional nodes and properties allows for a more comprehensive representation and enables more sophisticated analysis. The resulting graph model will depend on desired use cases and performance requirements, but the following are some potential expansions to the basic model:

Potential Expansions:

  • Organisational Units: Include departments, colleges, or schools to analyse timetabling within organisational structures.
  • Curriculum Data: Incorporate modules and programmes to understand the interconnectedness of courses and student enrolment patterns.
  • Activity Types: Differentiate between lectures, seminars, labs, etc., for a more granular analysis of teaching and learning activities.
  • Activity Delivery: Understand teaching delivery (virtual, in-person, hybrid, drop-in).
  • Student Attributes: Add properties like “international student”, “reasonable adjustment flag”, “first-year student”.

The below image (click to enlarge) shows a graph model augmented with additional data contained within the timetable database. It is much richer and therefore more complex, but this allows for richer analysis.
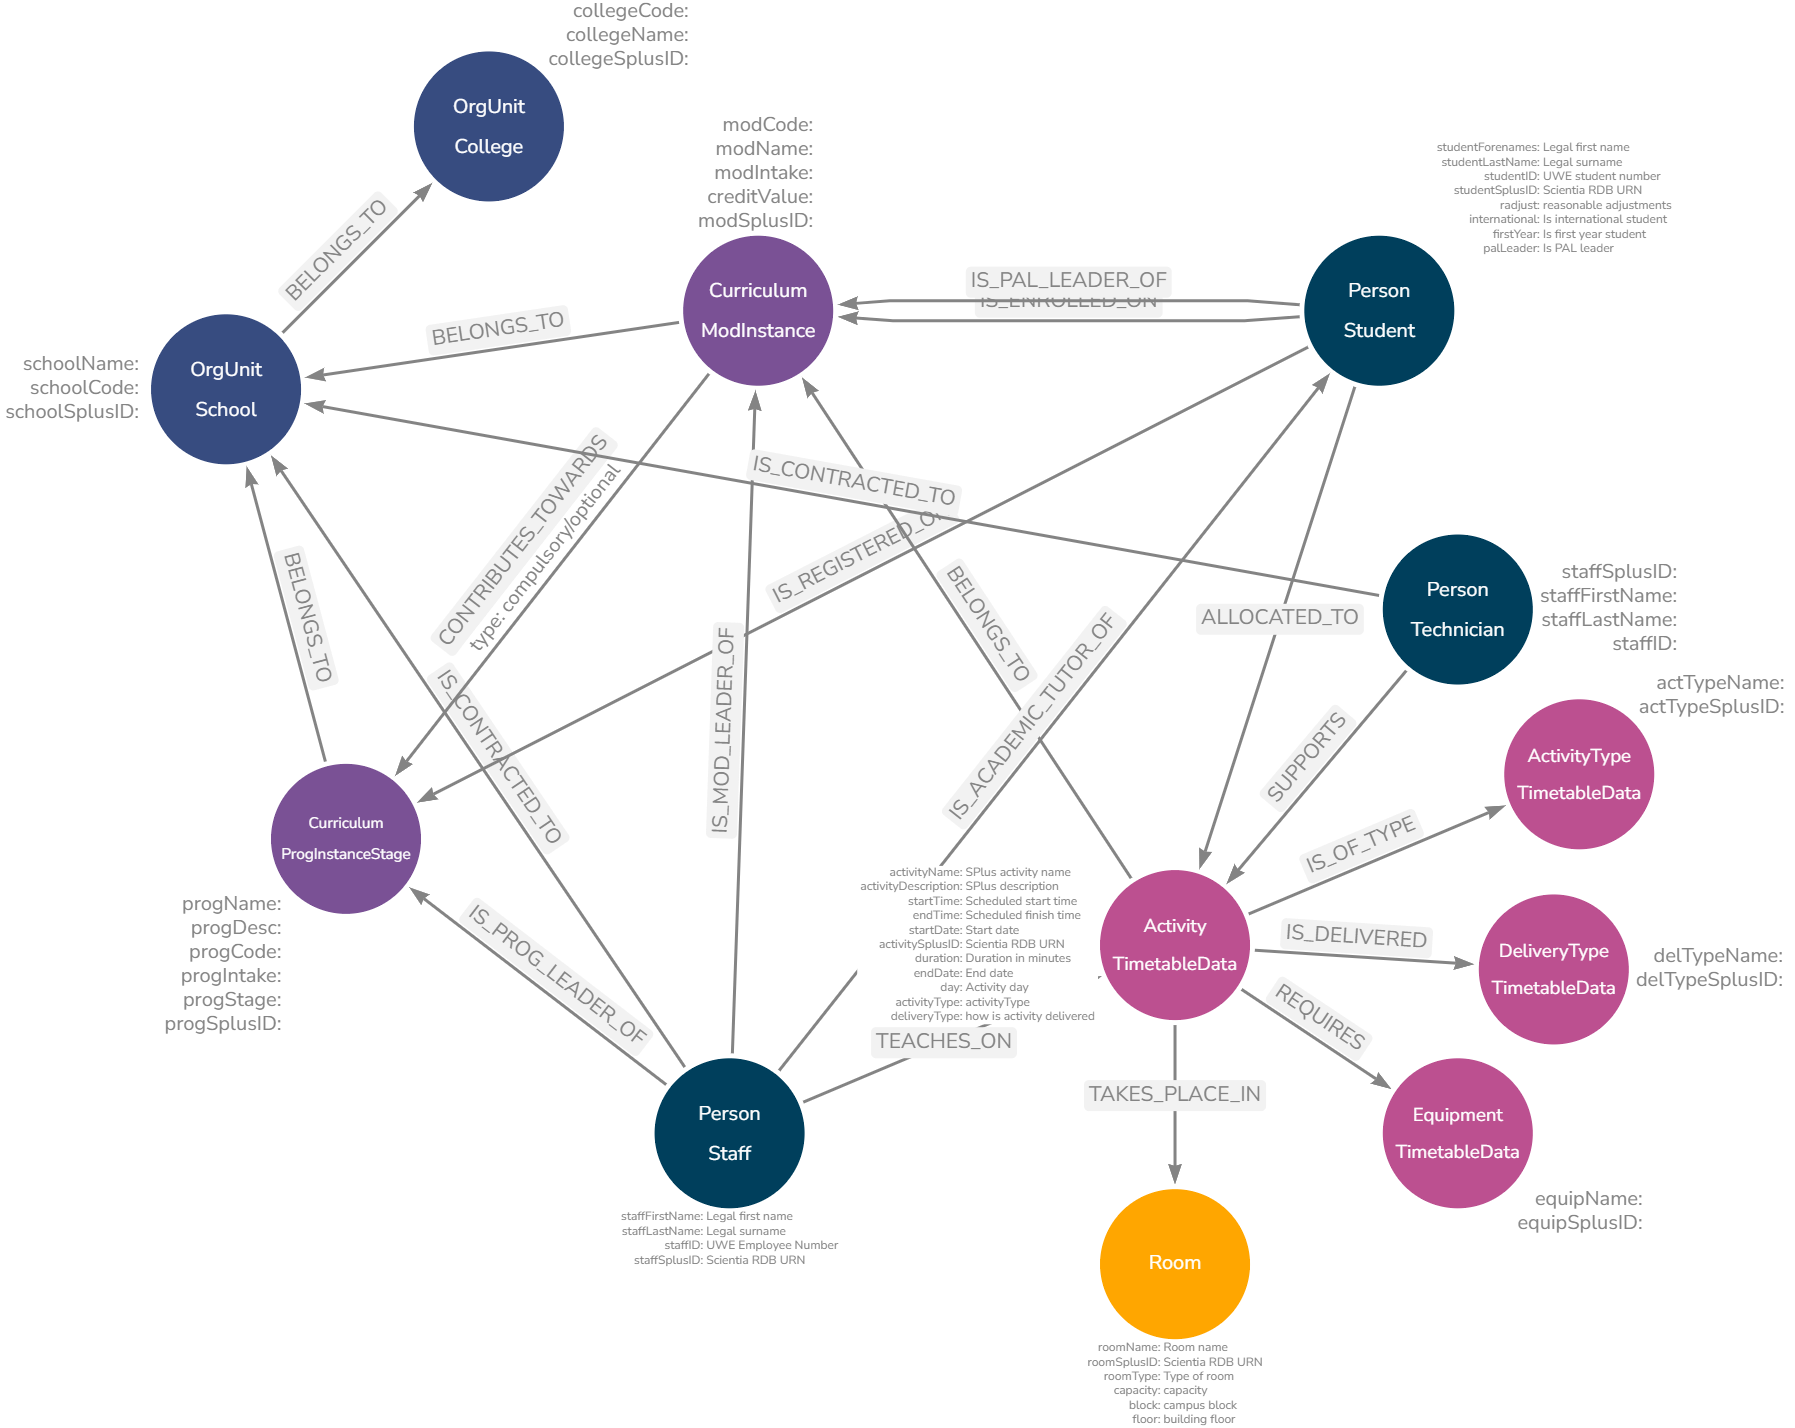
Example of Expanded Timetable Graph Model

Example of Expanded Timetable Graph Model
Early Insights
Graphing Time

Copyright 2024, Petter Lövehagen


Built with Quarto